


Sentiment Analysis is a crucial feature in Interact that enables businesses to assess customer emotions in real-time. By analyzing text-based interactions such as emails, chats, and social media comments, the system categorizes sentiments as positive, neutral, or negative. This helps organizations understand customer perceptions, improve service quality, and proactively address issues before they escalate.
The main intent behind Sentiment Analysis is to classify customer interactions based on sentiment, allowing support teams to prioritize and respond effectively. A negative sentiment, for example, may indicate frustration or an unresolved issue, prompting immediate attention from agents. Positive sentiments, on the other hand, highlight areas where service is excelling and can be leveraged for customer engagement and brand loyalty.
Understanding Sentiment Analysis
What is Sentiment Analysis?
Sentiment analysis is a natural language processing (NLP) technique used to determine the emotional tone or attitude expressed in a piece of text. It is often used to identify whether the sentiment in a text is positive, negative, or neutral, and sometimes even more nuanced emotions like happiness, anger, sadness, or excitement.
How It Works?
Sentiment Analysis works by analyzing textual data from multiple sources such as emails, chat messages, reviews, and social media comments. The system processes this data using AI-driven models to:
- Identify sentiment polarity (positive, neutral, or negative).
- Detect key phrases, entities, and recurring themes.
- Generate insights into customer opinions and concerns.
The results are then visualized through charts, reports, and dashboards, helping businesses make informed decisions.
Importance of Sentiment Analysis in Customer Support (How Sentiment Analysis Helps?)
Sentiment Analysis plays a crucial role in enhancing customer support by:
- Identifying Pain Points: Understanding negative feedback to improve service quality.
- Enhancing Customer Experience: Addressing concerns proactively to boost satisfaction.
- Improving Agent Performance: Providing insights into how customer support representatives interact with customers.
- Maintaining Brand Reputation: Monitoring trends in sentiment to address issues before they escalate.
- Optimizing Support Strategies: Data-driven decision-making for improved customer service processes.
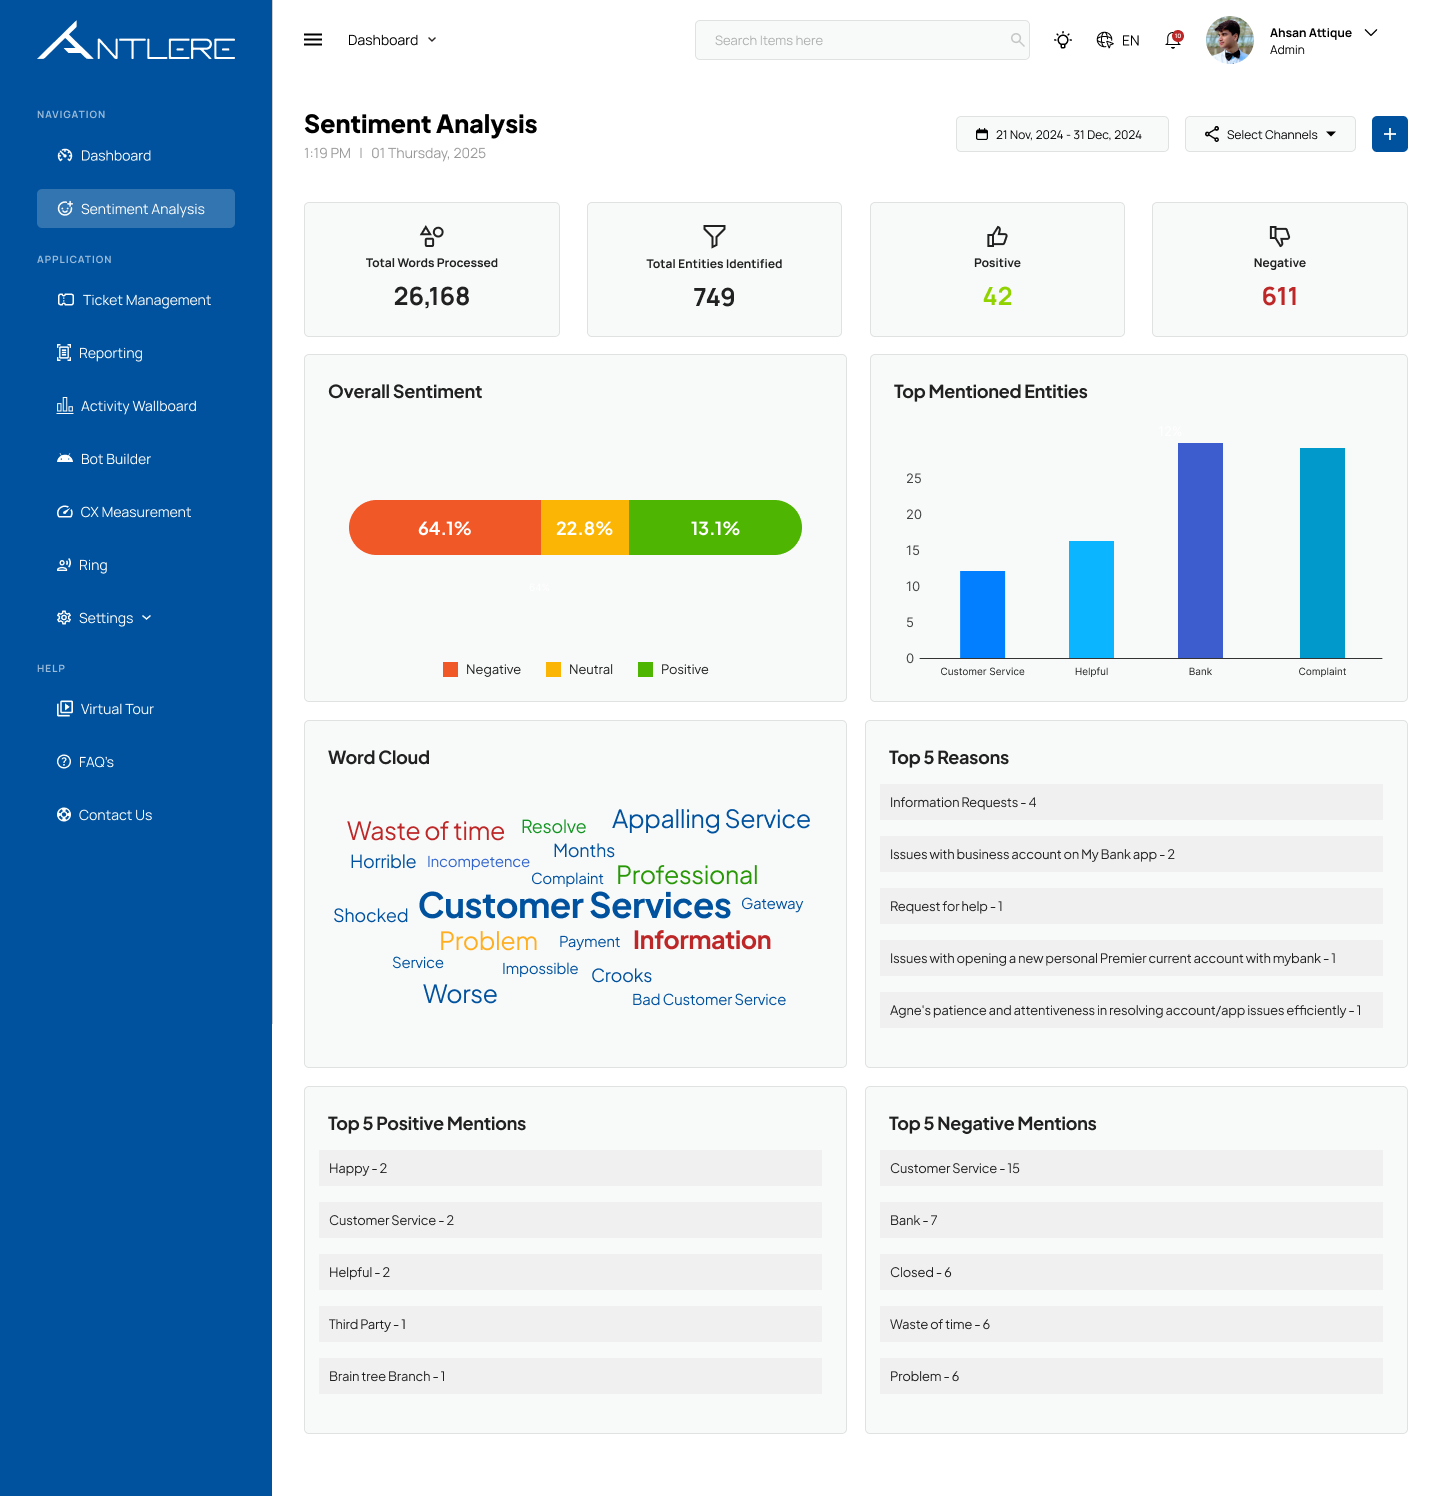
How Our System Helps Analyze Customer Sentiments?
Our Sentiment Analysis system uses advanced natural language processing (NLP) and machine learning algorithms to categorize customer interactions into different sentiment types. The system provides:
Our Sentiment Analysis system tracks the following key metrics:
- Overall Sentiment Analysis: Displays the percentage of positive, neutral, and negative sentiments from customer interactions.
- Total Words Processed: The number of words analyzed to extract sentiment insights.
- Total Entities Identified: Identifies frequently mentioned keywords and topics related to customer concerns.
- Top Mentioned Entities: Highlights the most frequently mentioned terms, such as products, services, or support issues.
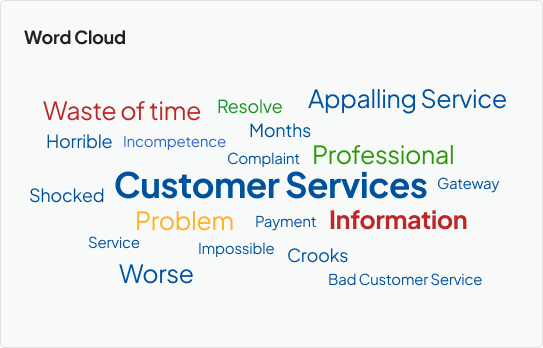
- Word Cloud: Provides a visual representation of commonly used words in customer feedback.
- Top Positive and Negative Mentions: Lists the most frequent positive and negative aspects to help businesses focus on key improvement areas.
- Top Reasons for Customer Feedback: Analyzes the main causes of customer sentiments, assisting in addressing critical service gaps.
Analyzing the Sentiments:
The Sentiment analysis predicts whether the customer feels positively or negatively about the request they are submitting. The forecast is determined based on the wording of the first message in the ticket and is divided into the following categories:
- Positive: The message is likely to include words of thanks or one to two positive statements.
- Neutral: The message is likely to include factual assertions without extra negative quantifiers (such as “any” or “always”), or a combination of positive and negative claims.
- Negative: The communication is likely to contain statements indicating displeasure, complaints using negative language, or repetition of the same unhappiness.
Interpretation (Distribution Chart)
The Sentiment Analysis dashboard provides a distribution chart that visually represents the breakdown of customer sentiment into positive, neutral, and negative categories. This chart helps businesses quickly assess the overall customer mood and detect trends over time.
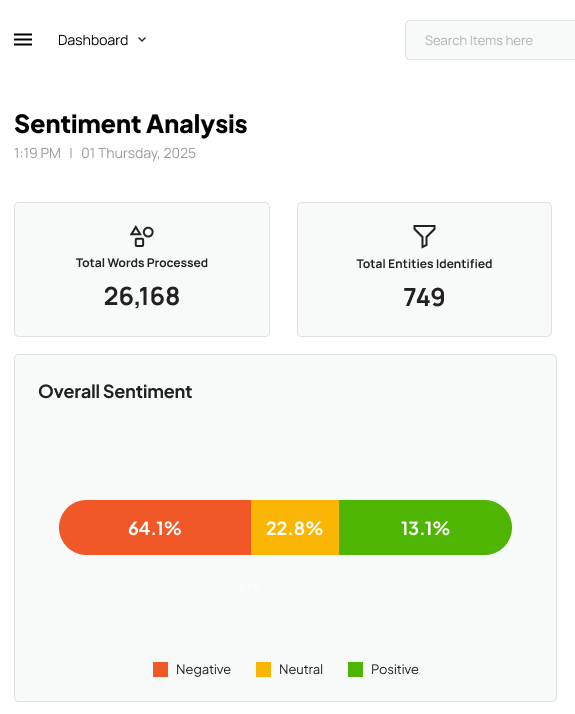
- Positive Sentiment: Indicates satisfied customers and highlights areas where service is excelling.
- Neutral Sentiment: Represents interactions that lack strong positive or negative emotions, often requiring further investigation.
- Negative Sentiment: Highlights customer dissatisfaction, signaling areas that need immediate attention
By analyzing this distribution, businesses can make data-driven improvements to their customer support approach, ensuring a more responsive and personalized experience.
Identifying Common Customer Concerns
One of the most powerful aspects of Sentiment Analysis is its ability to detect recurring customer issues. By analyzing feedback across various channels, the system identifies common concerns that impact customer satisfaction.
Key insights include:
- Frequent complaints about service quality, response time, or unresolved issues.
- Repetitive requests for specific features or improvements.
- Patterns in customer dissatisfaction, allowing businesses to prioritize problem-solving.
By pinpointing these concerns, support teams can proactively address issues before they escalate, enhance response strategies, and improve overall customer experience.
Top Issues and Reasons
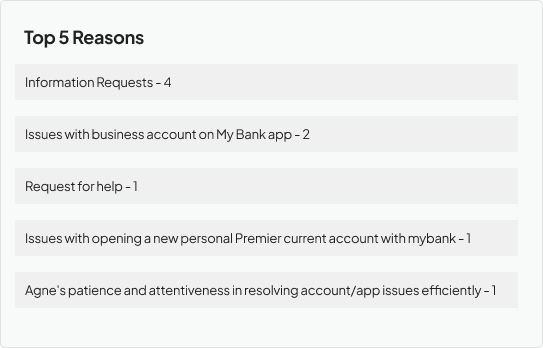
The Sentiment Analysis system categorizes the top issues reported by customers, providing a clear understanding of the main pain points. This section of the dashboard displays:
- Most reported problems: Identifies key challenges affecting customers.
- Reasons for dissatisfaction: Highlights specific complaints, such as technical difficulties, long response times, or account-related issues.
- Impact analysis: Helps businesses prioritize urgent concerns based on frequency and sentiment intensity.
By continuously monitoring these top issues, companies can implement targeted improvements, refine policies, and optimize customer support operations.
Top Mentioned Entities
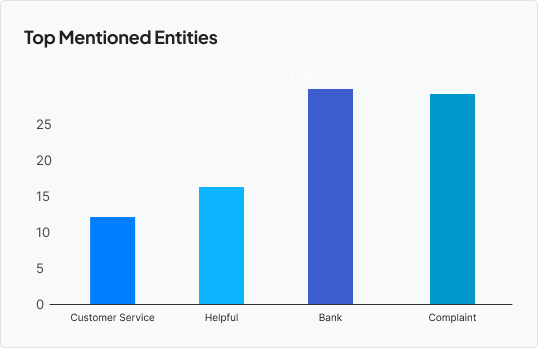
The Top Mentioned Entities section showcases the most frequently discussed topics in customer interactions. These entities can include:
- Company products or services receiving the most attention.
- Customer support agents mentioned in feedback.
- Recurring keywords linked to complaints or praise (e.g., “slow response,” “great service,” “billing issue”).
Tracking these mentions allows businesses to understand what aspects of their services generate the most discussion—whether positive or negative—and take strategic action to enhance customer satisfaction.