


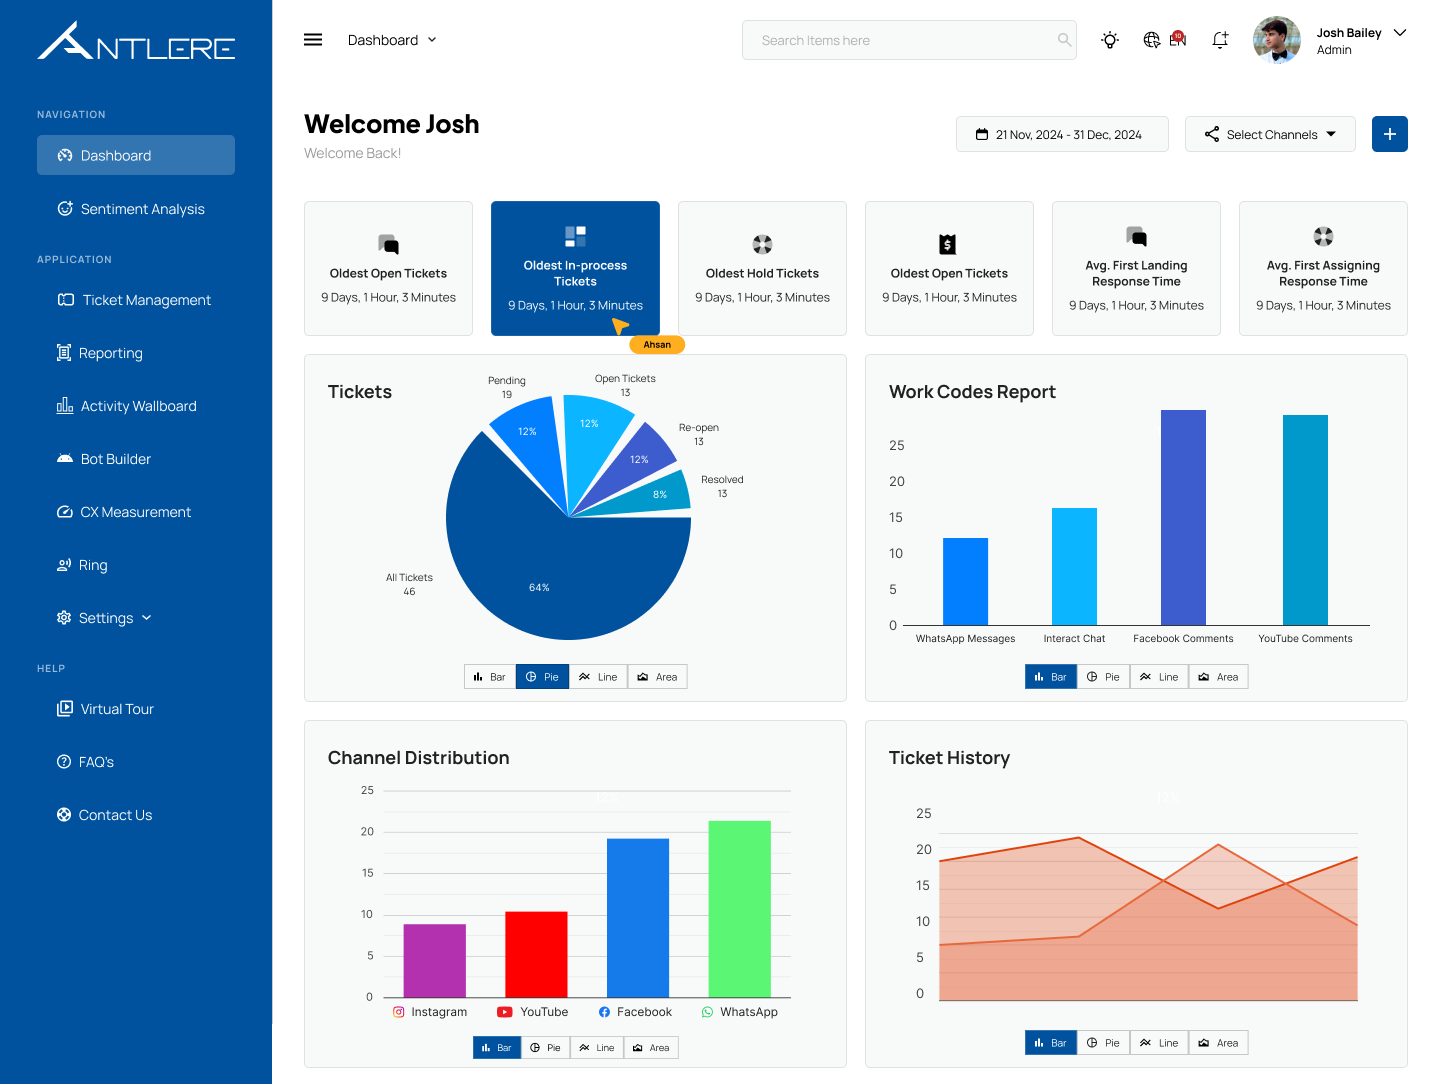
The dashboard provides a comprehensive view of ticketing operations, key performance metrics, and system analytics. It enables users to monitor customer interactions, track agent efficiency, and identify bottlenecks in support processes. The dashboard offers actionable insights to improve customer experience and streamline support workflows.
It serves as a centralized hub, consolidating customer interactions from various platforms into a single view. This enables swift decision-making and provides immediate insights into the effectiveness of support processes. By offering a comprehensive overview, the dashboard ensures that all customer interactions are readily accessible, facilitating efficient monitoring and management.
The dashboard consists of multiple widgets and charts, each displaying critical business insights. It includes:
- A summary of ticket statuses and response times.
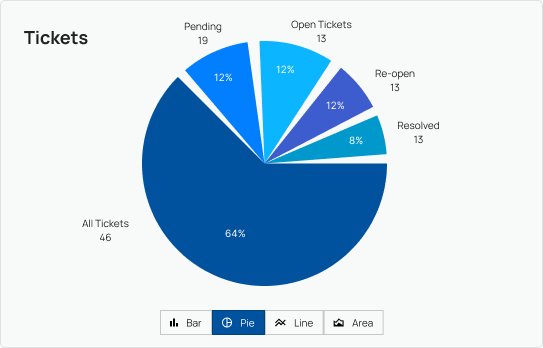
- Visual representations of ticket distribution and work codes.
- Filtering and sorting capabilities for efficient data analysis.
Deep Dive into the Dashboard
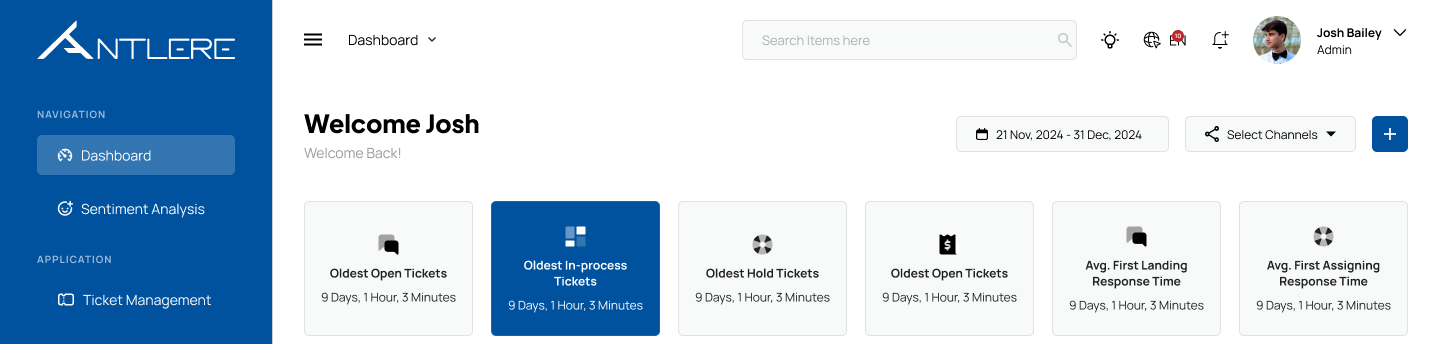
The dashboard is designed to be intuitive and user-friendly, allowing users to quickly access the information they need. It is divided into several key sections:
- Navigation Panel: Located on the left side, this panel includes various modules such as Dashboard, Ticket Management, Reporting, and Settings.
- Header Section: Provides options like date range selection, channel filtering, and user profile settings.
- Main Dashboard Area: Displays multiple widgets and data visualizations, offering real-time insights into ticket activity and response times.
Each component plays a vital role in helping users navigate the system effectively and gain meaningful insights from their support operations.
Understanding the Key Metrics
1. Ticket History
The Ticket History graph visualizes the number of tickets processed over a given period. Users can track trends in ticket creation, resolution, and reopening rates, allowing them to identify fluctuations in workload and agent performance.
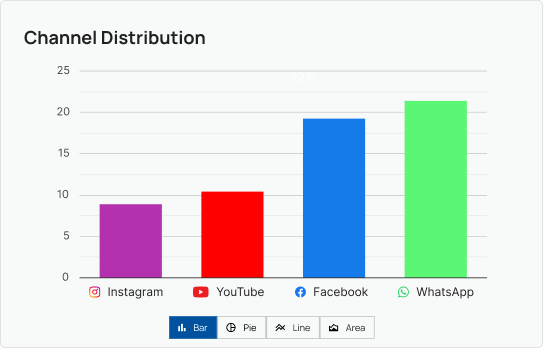
2. Channel Distribution
The Channel Distribution map highlights where customer interactions originate. This helps businesses understand which regions or platforms require more focus and resource allocation.
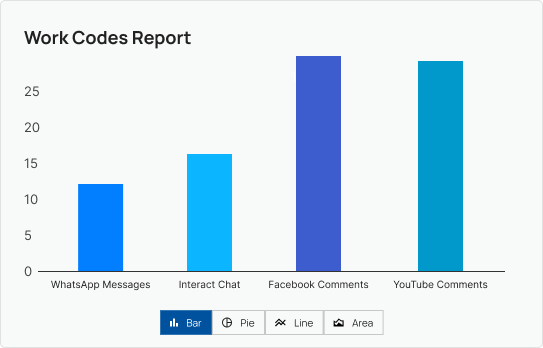
3. Work Code Reports
Work Code Reports are analytical tools that provide insights into the allocation of time and resources across various tasks or projects. They help organizations monitor and assess how effectively their teams are utilizing their time, enabling better decision-making and resource management.
The Work Codes Report bar chart categorizes customer interactions by type, such as WhatsApp messages, Facebook comments, and live chat interactions. This metric helps managers determine the most frequently used support channels and optimize resources accordingly.
4. Aging of Tickets
The Aging of Tickets section displays the oldest open, in-process, and hold tickets. This metric helps teams prioritize unresolved issues, ensuring customer queries are addressed promptly. By tracking aging tickets, organizations can improve response times and enhance customer satisfaction.
Customized Dashboards
Interact offers a custom dashboard-building feature, allowing businesses to design their dashboard layout based on their unique operational needs. This ensures that support teams have access to the most relevant metrics and insights, enhancing efficiency and decision-making.
Key Features of Custom Dashboard Building in Interact:
- Widget Selection – Choose from various data visualization elements such as charts, graphs, lists, and tables to display key metrics.
- Custom Filters & Views – Apply filters based on time periods, ticket categories, sentiment trends, or customer touchpoints for a more granular analysis.
- Multi-Channel Monitoring – Configure dashboards to focus on specific support channels, including email, chat, social media, and phone interactions.
- Role-Based Access – Different team members can have customized views based on their roles, ensuring agents, supervisors, and managers see only the data relevant to them.
Benefits of Custom Dashboards in Interact:
- Enhanced Visibility – Teams can monitor critical KPIs without navigating multiple reports.
- Improved Efficiency – Agents and managers get quick insights into performance and workload distribution.
- Real-Time Data Monitoring – Dashboards update dynamically, providing the latest information on ticket trends, sentiment analysis, and customer interactions.
- Data-Driven Decision Making – Custom dashboards help teams track service performance, identify bottlenecks, and optimize workflows.